Introduction Questions
Data is made geospatial if it has a geographic and/or locational component to it. Specifically, this can include but is not limited to GPS data, satellite imagery or even your address or ZIP code. Two forms of geospatial data include vectors which use points, lines, and polygons to represent spatial features, and rasters which use cells to represent special features. Today’s data is geospatial in nature because it goes beyond imagery data by including data attributes.
What makes data in a GIS different than a digital map?
GIS is different than a digital map because a digital map is a jpeg, while a GIS can include data attributes such as smart maps, click on point, coordinates, attribute data.
Why is having an understanding of geospatial concepts and geospatial data so fundamental to working with UAS data?
Having an understanding of geospatial concepts and geospatial data is fundamental to working with UAS data because if you do not, consequences such as a failed mission, poor data, wasted time and loss of money to your clients can occur. Not only that, but entire projects can fail, technology can be underutilized and your overall credibility in the industry could be questioned.
What are some of the key geospatial concepts and fundamentals that this lab addresses?
This lab address key geospatial concepts and fundamentals such as learning how to navigate Arc Map, and Arc Pro. In addition, to learning about those programs, it helps us visualize examples of what holistic geospatial data can do as demonstrated by the various files that include but are not limited to rasters, text, point, line, polygone, etc..,
Working with the Data (Overview)
File management is key with working with UAS data, because if you do not manage your files correctly, sensitive information could be lost, unorganized files could result in poor data analysis, and you could lose overall time/money as a consequence of the mismanagement.
ArcCatalog Questions
The purpose of establishing a folder connection is to have pertinent data available to the folder in a convenient known place. In addition the folder connection enables information to be saved on a cloud source data rather than a poorly made I-Tap computer.
What is the difference between viewing the files in Arc Catalog vs. Windows explorer?
As seen in figure 1, the files in ArcCatalog appear to have better icons which enables me to more conveniently distinguish what the files are compared to the files in Windows explorer which can be seen in Figure 2.
 |
| Figure 1: ArcCatalog Files |
 |
| Figure 2: Windows Explorer Files |
Why is it so important, beyond maintaining proper file management/naming, to use Arc Catalog for managing your GIS data?
It is important to use ArcCatalog for managing GIS data because ArcCatalog’s layout is relatively straightforward and can be taught to people within an hour. With this foundation, users can easily track files independently without completely losing them.
Take a close look at the files and note the icon to the left of the file.What do those icons mean? Hint: Use the preview tab to view the file. List out each of the geospatial data types, and then provide an example file for that data type.
 |
| Figure 3: Geospatial Data Types |
- An an example of a Polyline could be a tornado track.
- An example of a Polygon file could be a state.
- Am example of a Raster file would be a tornado file screenshot
- An example of a Text file would be the dams text.
- An example of a Point file would be a location to the dams point file.
- All of the above geospatial types can be seen in figure 3
What topic/term relates to this description tab? Why is having this information so important in the UAS realm?
Metadata is information that you need for the entire project. Metadata is significant for passing on and processing purposes because it includes data essential for correct processing. If people don't have the correct data, processing will glitch and the data will be underutilized and potentially fail.
After you select properties, you will see a table with all sorts of information to come up. Before we get into it too much, scroll down to the statistics section.What does it say?
After scrolling down to the statistics section, if found what can be seen in Figure 4.
- Applying a contrast sketch.
- Applying a classification.
- Min DSM Elevation=0
- Max DSM Elevation=323
- Mean DSM Elevation=163.90
There is more useful information in this table. Provide the following information:
- Cell Size: 0.02077, 0.02077
- Format: TIFF
- XY Coordinate System: WGS_1984_UTM_Zone_16N
- Linear Unit: Meter (1.000000)
- Datum: D_WGS_1984
- Use the Linear unit and write the pixel size in square cm: 4cm^2
ArcMap Questions
Referring to your notes from the demo/lecture, list out some different ways to add data.
- Click on file and then click on “Add Data”
- Open a base layer, locate file connections on ArcCatalog, drag that file from ArcCatalog to ArcMap.
Before we add UAS data, lets add a basemap, and a few other types of data. Examine the basemap options, and add a basemap of your choice. What basemap did you use? Why?
The basemap that I chose to use was a Topographic map. I chose this mao because it was relatively simple to view, and I was familiar with its appearance when it was demonstrated by Professor Hupy.
Go into the Tornadoes folder, and add the states.shp shapefile. The basemap can bog things down, so let’s go ahead and uncheck reference and basemap. What type of GIS data is this? Justify your answer.
This type of GIS is a Polygon file. This is a polygon file because it has an enclosed shape as an icon as well as data attributes.
Now add the TORNADO_tracks.shp file. What type of GIS data is this? Justify your answer.
This type of GIS data is a polyline file. This is a polyline file because it has a line with points on it like the icon. In addition, when you click on the file and drag will notice that it makes the tracks that it symbolizes and that you can view attributes for each tornado.
Let’s add one other kind of file. Go into the hydro features folder, and add the dams00x020.shp file.What type of GIS data is this? Justify your answer.
This type of GIS data point file. This is a point file because every hydro plant is represented by a point, and when you click on a point, the associated data attributes appear.
In Figure 5 is the coordinate system for the tornado tracks file on the map of the United States..
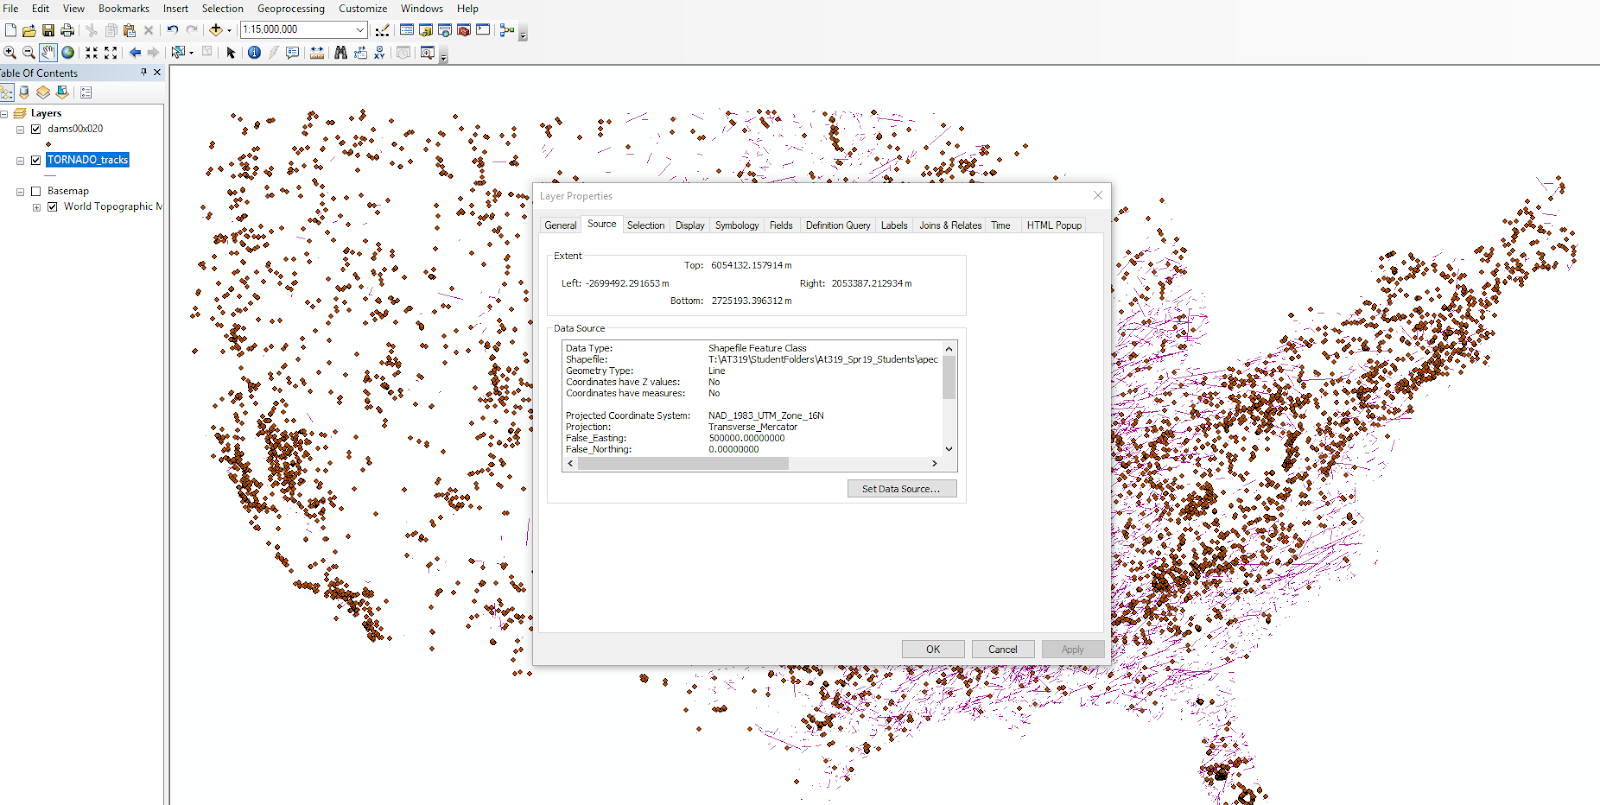 |
| Figure 5: Coordinate System for Tornado Tracks in the United States |
Referenced in figure 6, is the coordinate system for hydroelectric dams.
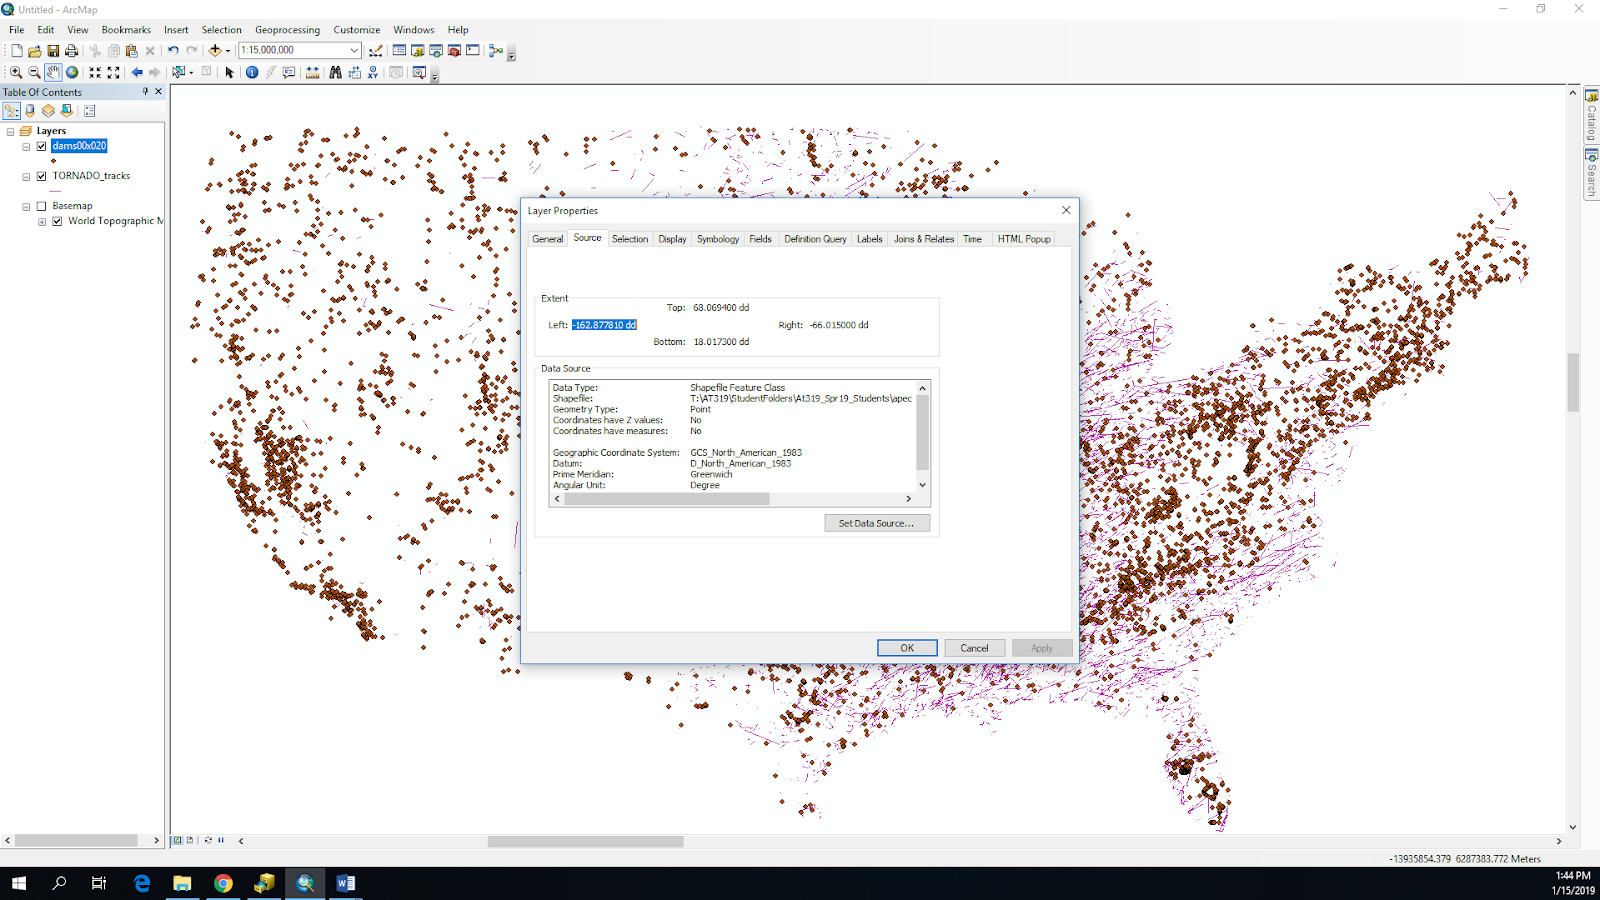 |
| Figure 6: Coordinate System for Hydroelectric Dams in the United States |
Referenced in Figure 7, is the coordinate system for the states.
 |
| Figure 7: The Coordinate System for the States |
Are all of these coordinate systems the same? Why might that be an issue?
How might the need for metadata relate to coordinate systems.
The need for meta might is important because coordinate systems need to have the correct data to run smoothly. Although it can be confusing having to work with so much metadata, having too little data will hinder the ability to define locations, surfaces, and other pertaint mapping information.
Think of some different types of attribute data that could be used in conjunction with UAS data and list it here with a use example.
- Aircraft accident sites
- Wind turbine farms
- Weather stations
- Pipeline inspection
- vehicle accident sites
- What type of data is this? A raster with red, green and blue values
- What is the format? TIFF
- What is the projection? UTM
- Projected Coordinate System: WGS_1984_UTM_Zone_16N
- Projection: Transverse_Mercator
Does this projection match the Ortho? Why is this so important?
Yes, this is important because if it didn't we would have false information.
Zoom in over a few of the GCP points. Do the points line up with the markers on the ground?
Yes, this tool might be useful in working with UAS data because it could measure distances above objects and display the distances with several different units of measurement.
Identify: Use the identify tool on several of the GCP points. Also, turn on the DSM and identify pixels on that layer. How might this tool come in handy when working with UAS data?
Identify: Use the identify tool on several of the GCP points. Also, turn on the DSM and identify pixels on that layer. How might this tool come in handy when working with UAS data?
Swipe: Use the swipe tool to move between the Orthomosaic and the DSM. How might this tool be useful when working with UAS data?This tool might be useful when trying to illustrate to a client the difference models that can be displayed and compared to when using the data.
Measure: Measure several features on the map. How might this type of tool be useful in working with UAS data?
This tool might be useful when working with UAS because it could measure distances above objects and display the distances with several different units of measurement.
No comments:
Post a Comment