Monday, April 8, 2019

Field Study- Working on a Ground Control Point Crew


Introduction


For this outdoor lab, myself and 4 other members of the UAS class were tasked with placing ground control points for a M600 flight. In an effort to test whether or not someone took good notes, we were given field notes of someone who was on a ground control point team from a previous mission and tasked with placing the ground control points in a better format. When placing ground control points, it is important to ensure that they are:
  1. Clear from tree coverage
  2. In adequate separation from one another
  3. Encompassing the parameters of the mission
  4. Accounting for various terrain
  5. Mapped out on a physical paper so that you can find them later
  6. Within eye-site of each other
  7. Turned on the moment before they are placed
  8. Kept running for at least 40 minutes to collect data
  9. Are numbered basted on their last 3 digit IDs
  10. Are collected in reverse order
Figure 1: Martel Forest GCPs

Methods


Although I said I created map based on the watermark in the left hand corner, it is not technically a map since it doesn't have a scale bar. Nevertheless, this shows the Ground Control Point Locations from an aerial view. Below is a chart in Figure depicting the Ground Control Point order, the ID, and the location. 
Figure 2: Ground Control Point Data

DJI M600 


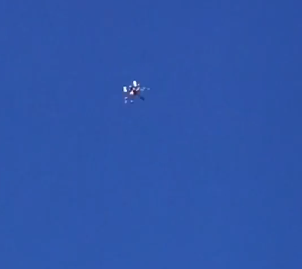
The DJI Matrice 600 is an industrial UAV that weighs approximately 34lbs has a flight time of approximately 20 minutes and has triple redundant GPS units. As shown in figure 3, it is a hexacopter that appears a lot bigger in person and therefore is difficult to visually estimate in the air due to its size. The mission planning program used for this platform was pix4dcapure which is a free photogrammetric software. 


Figure 3: DJI M600

Conclusion


As you will see in the video, the UAS was first tested in flight, and then autonomously taken over for the mission. Something that is important to note in the video is when the UAV goes to its way-points, Pix4D rotates it quickly in mid air. Although this enables an time saving and accurate flight, how do we know what orientation the UAV is when it is that high? 
Video: DJI M600 Flight


Lab 10: Processing Oblique UAS Imagery Using Image Annotation

Introduction

To date, we have been gathering imagery in nadir format. According to photogrammetry.com, nadir is defined as the camera pointing straight down. While this is a great means for producing orthomosaics and DSMs in bundle block software such as Pix4D, this method does not do well capturing vertical structures/objects. Therefore, the camera must be flown at different non nadir (aka oblique) angles in order to produce optimal results. Shown in Figure 1 is a UAV flying in nadir and a UAV flying non nadir. 
Figure 1: Nadir vs Non Nadir Flight

Since the geospatial world is moving rapidly towards being exclusively 3D being able to produce 3D datasets and incorporating the data sets  into a GIS is a strong market trend. In this activity, I am going to perform a quick demonstration of processing Oblique UAS imagery. To anyone that has don't this, I envy you. Unless you have a passion, patience, and a robust data processor, you will likely have to spend alot of time waiting for the data to process and potentially experience slow results. Nevertheless, processing oblique imagery can yield spectacular results when done with the right attitude software, data etc..,

Questions to Consider

In this section, it is important to cover other important topics that will help enrich the understanding of this lab. Below are the topics in question and answer format. 

What are some advantages and disadvantages of mapping nadir vs oblique angles? 
  • Advantages of Nadir
    • No need for varying camera angles . 
    • Nadir missions can be laid in any orientation
    • Mission pre-planning does not have to account for potential varying obstacles
  • Disadvantages of Nadir
    • It does not capture vertical surfaces
    • Contains less information than oblique image collection
    • Nadir imagery are less likely to process 3D models of vertical structures
  • Advantages of Oblique 
    • Ideal for 3D objects. 
    • 3D models typically have more information than nadir models
    • It can also still capture some horizontal surfaces
  • Disadvantages of Oblique
    • Not alot of autopilot options
    • Depending on the subject, it could require beyond light of sight risk
    • Unwanted data from oblique processing could occur which will therefore require image annotation
What is Image Annotation? 
According to Pix4D Support, Image Annotation is a feature that removes an object that appears in some images, the sky for oblique images, a constant object that appears in all images, or the background of the Orthoplane.

What Phase of Processing is Image Annotation Performed? 
typically, this is performed in the Initial Processing Phase. However if data is already available, one can annotate the images again after adding a point cloud and mesh. In this lab, I constantly had to reprocess data in order to see the differences. 

What types of Image Annotation are there? 

Referring to the on Pix4D help section  mask, carve and global mask are three main types of Image annotation. Below is a description of each, and examples of what they apply to:

  • mask: this tool can be used to remove from the point cloud an obstacle that appears in few images, like a scaffold. All the images in which the object appear should be masked and step 2 should be rerun after masking.
  • carve: each annotated pixel has an impact on the point cloud. The effect of the annotation is immediately visible in the 3D View of the rayCloud and it is easy to notice if some pixels were erroneously annotated so as to be corrected immediately.
  • global mask: can be used to remove an obstacle that covers the same pixels in all images, like the foot of a drone. Only one image should be annotated and the annotation is propagated in the same pixels of all the images. If you have multiple objects to remove you can do it by annotating different images, one per object. However, in case that the objects appear in different locations on the images (different image coordinates), it is recommended not to use this tool as it will remove also other important information. In such cases, the mask tool is a better and safer option, even if it is more time-consuming

Methods

Like previous labs, I will use a tutorial style format to explain my findings while processing oblique imagery. In an effort to focus on the oblique imagery data processing, I have hyperlinked other labs to refer to in case you are interested in more specific information. 
  1. Collect Oblique Imagery- knowing that you will need multiple flights, take into consideration the height of the structure with respect to the angle of your camera. In Figure 2 is an example of different camera angle options around a subject taken from. Drone Deploy.com
    Figure 2: Different Camera Angle Options
  2. Log Into Pix4D Mapper and create a new project as shown in Figure 3. 
    Figure 3: Creating a New Project in Pix4D Mapper
  3. Select and Upload your images- this had been demonstrated in lab 6. Therefore, feel free to reference the figures there in case you want to see a more comprehensive demonstration.
  4. Shown in figure 4, is a provided data set from a UAS that flew circular pattern over a truck. This was processed before using image annotation.
    Figure 4: Curricular Pattern of Collecting Oblique Imagery
     
  5. Once the initial processing is complete click (on) the pencil Icon on the right side of the screen. You then have the option to use any of the image annotations that I previously listed. 
  6. After you decide your image annotation that you would like to do, you will have to left click and paint around the area you want to rid of. In order to see a difference, I had to process, and annotate for several hours in order to get the truck to be by itself. Although this is nowhere near perfect, click on the video below to see the difference compared to Figure 4. 
    Video of Truck Click here 
For a bonus, in the following video is  annotated light pole data flown by a UAV and processed after several hours.
Video of Light Pole Click Here

Conclusion

Since this is first time I've experienced image annotation, I am still exploring the data-sets, the tools, and how to make the data appear more cleaner. Although the images appear less noisy, there is plenty of work left to do. Nevertheless, processing data and editing it with the image annotation tool is another item that will factor into the interpretation and analysis of UAS data. Now, instead of having a huge image with terrain in the background, the object of interest is clearly defined enabling stakeholders to focus in on it. 

Monday, April 1, 2019

Crew Resource Management 101


Overview

In the last blog post, we examined the Yuneec H520 Case Study In this blog post, we will go over  basic topics regarding Crew Resource Management (CRM), what it is, and how it can be used in UAS operations. In the future, I plan to dedicate an entire section of my blog to CRM but for now take a look at what I have found so far.

What is Crew Resource Management?

As a fairly large topic, Crew Resource Management (CRM) covers a variety of subjects in aeronautical decision making. If you want to learn more about the literal definition, refer to the manned aviation language found in AC 120-51. Nevertheless, the same terminology is found 5 times in 14 CFR Part 107 (yes I counted five times). From what I learned, a broad definition of CRM is  working on a team based off a structural and procedural understanding. To simplify what good CRM criteria entails, refer to the list of Cs as defined by (Tomczyk 2016).

1.  Concise “Go/No Go” criteria.

2.  Clear responsibilities and roles.

3. A common language for standard and emergency procedures.

4. Crosscheck that gets everyone monitoring standard operations.

5. Checklists with cross-talk during operations with negative affirmatives

Crew Resource Management  Items for UAS

When planning and executing a mission, one must determine whether or not they should address the following items themselves or divide up the following items as a crew. Below, are bullet points and questions that I believe one must refer to when executing a UAS mission.

Pre-Planning

  • Is the mission feasible?
    • Does the mission meet Part 107/COA requirements?
    • Will LAANC be needed?
    • Selection of pilot for mission
      • Level of experience of pilot
      • Is Part 107 valid?
  • Size of mission
    • Airspace requirements?
    • Can the UAS be flown within line of sight?
      • Estimated Duration of Mission
      • Time of flight
        • does daylight affect the data collected?
  • Selection of UAV for mission
    • Selection of sensors
    • Fixed wing or multi rotor?
  • Selection of mission planning software
    • Is the software open sourced?
    • Is the software expensive?
    • What part of the mission will be manually controlled?
  • Selection of Ground Control Station
    • Is Wifi Available?
    • Estimated time to set up all components of Ground Control Station
  • Battery Considerations
    • Battery of UAV
    • Battery of camera
    • Battery of sensor
    • Battery of viewing screen for camera
    • Battery of Laptop 
    • Battery of transmitter
    • Back up batteries?
    • Voltage readers?
    • Temperature limitations for batteries
  • Applications that will be utilized
    • Pix4DMapper?
    • B4Ufly App?
    • Weather App
  • Will a Visual Observer (VO)  be needed?
    • Number of VOs present
    • VO training prior to mission?
    • Communication with VOs?
  • Safety
    • Risk assessment matrix
    • Part 107 reflective vest
    • Plan in case of an accident
      • Report to FAA
      • First Aid kit

Day of the Mission

  • Weather
    • Can UAS withstand conditions for proposed flight?
    • Does mission have to be adjusted due to wind, temperature, humidity etc..,?
    • What is visibility like?
  • Surveying the site of the mission
    • Any obvious hazards?
      • Clearance for UAV
      • Electromagnetic interference
      • Hazardous to the Pilot or the Ground Control Crew
    • TFRS, NOTAMS, No Fly Zones etc..,
  • Placing Ground Control Points
    • How many do you need?
    • Are they working properly?
    • Are they in optimal Locations?
    • Will you be able to find them after the mission?
Pre-flight Checklist
  • Has UAV been calibrated?
  • Has sensor been calibrated?
  • Current air traffic considerations
  • Wifi source?
    • Mobile hotspot
    • Mifi
  • Any signs of GPS interference, signal loss, or electromagnetic interference?
  • Who is participating in this operation?
    • VOs
    • Note takers
    • Do they know where first aid kit is?
    • Someone to talk to curious pedestrians 
  • Safety equipment
    • Eye protection 
    • Hard hats
    • First aide kit
    • Fire extinguisher
Takeoff

  • Pilot in Command (PIC)
    • Ensures that UAV is in condition for safe flight
    • Ensures that they themselves are in condition for safe operation
    • Is focused on the UAV at all times
    • Has current Part 107 licence! (or is overseen by someone who does)
    • Tests the UAS at a safe altitude before mission starts (ie pitch, yaw, rolll, range test etc..,)
  • Ground Control Crew
    • Maintains situational awareness of UAV 
    • Maintains situational awareness in proximity to PIC
    • Communicates with one another about potential obstacles when necessary
    • Collects data from Ground Control Station
During Mission
  • Pilot in Command (PIC)
    • Notes battery life, transmitter life, altitude, and way-points of mission
    • Has an emergency response plan in the event of a malfunction
    • Is constantly on the lookout for hazardous such as other air traffic

  • Ground Control Crew
    • Is noting Key Metadata
    • Is observing the UAS flight and ready to communicate to the pilot of any hazards
    • Is making sure the Ground Control Station is operating properly
Post Mission
  • Pilot in Command (PIC) 
    • Lands UAS in a safe and secure manner
    • Powers off UAS in reference to industry recommendations
    • Assists ground Control Crew in dissembling ground control station and UAS
    • Documents UAS flight in logbook 
    • Key Metadata
  • Ground Control Crew
    • Ensures data is properly collected and saved
    • Assists PIC in dissembling ground control station and UAS
    • Documents UAS flight in logbook for redundancy and cross referencing purposes
    • Key Metadata

Conclusion

As stated before, this is an introductory post about CRM. Generally speaking, the more robust the UAS technology is, (and depending on the mission) the more elaborate your checklists, organization and pre-planning must be. Also not that each system will needs its own CRM procedure which is important because the most experienced pilots believe that they can ignore checklists if they aren't any -this is how accidents occur. Although CRM can be daunting, to some, effective UAS operations will allow you to increase your credibility as an organization which can help your businesses public relations sector, reduce the amount of insurance paperwork and even allow you to get special exemptions from the FAA. Therefore, CRM is vital to UAS and this blog post does not do its description enough justice. 

Reference
Tomczyk, W. (2016). Crew Resource Applications in Unmanned Aerial Vehicles Applications in Crew Resource Management ASCI 516. Retrieved April 1, 2019, from https://www.academia.edu/34112473/Crew_Resource_Applications_in_Unmanned_Aerial_Vehicles_Applications_in_Crew_Resource_Management_ASCI_516?auto=download

Thursday, March 28, 2019

Yuneec H520 Case Study


Scope of the Problem
Click on the above video and try to analyze the accident that occurred. What do you think happened? Could this have been prevented? For this lab, I am going to provide a brief analysis of factors that lead up to this incident and then provide recommendations on what could be done differently in the future.

Background
On Tuesday March 26th, 2019 at approximately 10:30am, our class was informed that we will fly a  quick mission at Martel Forest using the Yuneec H520 Platform. To help us understand what the location looked like, we were provided a satellite image as seen in Figure 1.
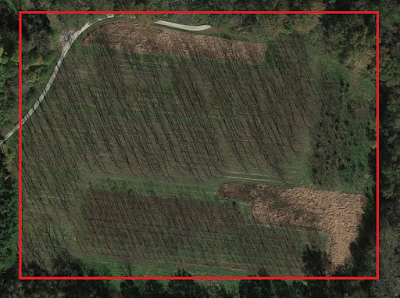
Figure 1: Martel Forest 
At approximately 11:00am, our class arrived at Martel Forest. According to the local KLAF METAR, wind was coming from the northeast at 7 mph, skies were clear with 10 sm visibility and the temperature was 40 degrees. We used the KLAF METAR because the operating area of the UAS was just outside the KLAF class D airspace and we therefore considered it as an accurate source of information. After splitting up into teams, we were then instructed to walk around the forest and note any obstructions. It is estimated that the trees were roughly 40 meters high as seen in Figure 2.
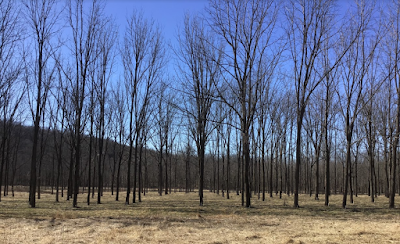
Figure 2: Ground View of Forest 
After consulting the B4UFLY mobile app, the class confirmed were in an area with minimal hazards and had two pilots set up the UAS, a team of visual observers, and a ground control crew. For the purpose of this mission, I was a Visual Observer that took field notes of the operation and was allowed to video record the flight since there were several VOs present as well. In figure 3, are the ground control points case in the bottom left, and the Yuneec H520 UAS case on the tale gate of the truck.
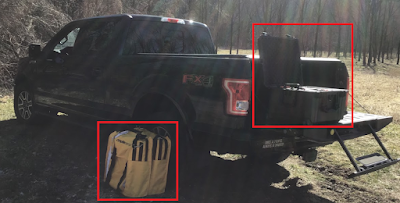
Figure 3: Ground Control Points and UAS Case
In Figure 4, is an image of myself taking notes of the UAS transmitter while cross referencing information on to my iPad. In the background is the ground control crew going to deploy the GCPs. Of the 15 of us that were on the sight of the mission, 10 of us (including myself) had our Part 107 licences.
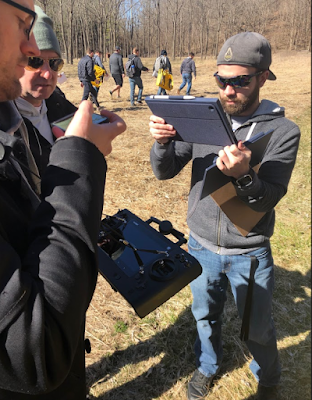
Figure 4: Myself, taking notes and the Ground Control Crew

In figure 5, are the the deployed Ground Control Points. For the purpose of this mission we used the Propeller Aeropoints. Construed of high density foam, these GCPs are rugged, relatively lightweight, and have an in-built GPS. In addition, they are solar powered, have a large memory and offer centimeter accuracy. In as little as 45 minutes they can find where they are in relation to themselves and be used by any GPS-enabled UAS.
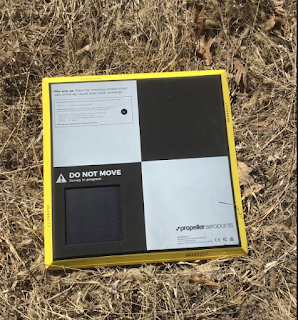
Figure 5: Uncased GCPs
In Figure 6 is the Yuneec H520 ST16S Personal Ground Station Controller powered by Intel. During the calibration, the transmitter displayed step by step diagrams on how to position the UAV. Something that I found was strange is the calibration included the rotors in the diagram. Although calibrating with the rotors on can increase the the likelihood of a smoother autonomous flight, any malfunction during the calibration phase could greatly increase the likelihood of injury.
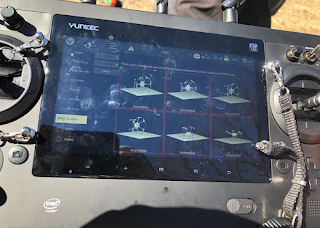
Figure 6: Yuneec Transmitter Callibration

In Figure 7, are my handwritten field notes for this mission. Although the majority of the rest of my notes were stored on my iPad, I believe that it is essential to have have handwritten notes because unlike an Ipad, you don't have to deal with a constant glare from the sun, you don't have to worry about battery life, and you don't have to worry about the storage being unintentionally deleted.
Figure 7: Handwritten Field Notes 
At approximately 11:30am the UAV took off climbed to an altitude and fell out of the sky. In figure 8 is a close up of the damage it suffered. As you can see, at least 3 arms are significantly damaged, and most of the motors  twisted from the propellers. In any UAS crash people must evaluate the circumstances of the damage and consider whether or not the crash has to be reported. Given the fact there was no collision with another aircraft, no one was injured, and no property damage occurred. This crash was omitted from being reported to both the FAA and NTSB. 
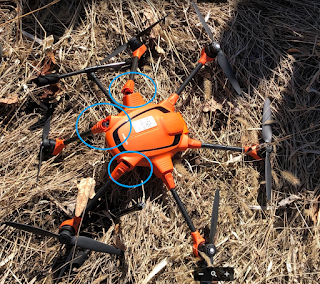
Figure 8:UAV Crash Site

What Went Wrong? 
Despite having a team of roughly 15 UAS students and two people that have used this UAS system regularly, we believe the cause of the accident was a combination of poor crew resource management and unclear manufacturing instructions. As seen in Figure 8, which is a screenshot in 22 seconds of the video, the UAV is working properly. In figure 9, one second later, the UAV abruptly stops working and completely shuts off as it falls to the ground.
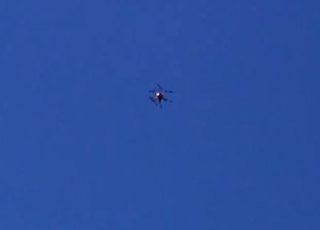
Figure 8: 22 Seconds
Figure 9: 23 Seconds


Results

After reviewing the video several times and discussing the topic of crew resource management with the pilots and the rest of the class, it is believed that the UAV suffered a catastrophic malfunction during its transition to autopilot mode. As we traced back the to the events while setting up the UAS, it is believed that a poor installation of the battery ultimately lead up to the UAVs malfunction. Due to the fact that the UAV abruptly fell out of the sky after slightly maneuvering to fix itself on a way-point, we speculate that the battery must have somehow dis-attached itself during that shift. Since the dis-attachment was not a result of flying in inclement conditions, it is possible that someone improperly installed the battery during pre-flight procedures. 

In addition, the design of the Yuneec has a very odd battery placement function which can confuse UAV pilots who work on multiple platforms regularly. For example, in a DJI platform, when the battery clicks into the UAV, one does not have to question whether or not the battery is secure because the clicking sound confirms that the battery will not be dislodged during UAV flight. In the Case of the Yuneec, the battery did click when placed into the UAV, but the clicking sound did not guarantee that the battery was secure. Due to the false assumption that a clicking sound guarantees the security of the UAV and due to poor crew resource management, the Yuneec H520 fell out of the sky. In the next Blog post, I have created an overview of crew resource management as it applies to UAS.

Wednesday, March 27, 2019

Lab 8 Geospatial Certification

Introduction

For this Project, I am earning a geospatial certification where I will be calculating impervious surfaces from Spectral Imagery. According to crd education, impervious surfaces are land surfaces that repel rainwater and do not permit it to infiltrate (soak into) the ground. In the context of this lesson, I am given a neighborhood geodatabase shown in Figure 1. To see the source of the lesson click here
Figure 1: Neighborhood Geodatabase 


Why impervious surfaces?

Aside from being a liability issue to a land owner, having accurate data about impervious surfaces can provide specific charges to individual land owners rather than having blanket charges. In other words, having data that can show more accurate impervious surfaces enables fairer taxes for homeowners. Currently, the image has bands and natural color combinations. In Figure 2: the neighborhood is adjusted with an extracted band and no yellow parcels. 
Figure 2: Neighborhood Extracted With Hidden Yellow Parcels
After using the Image Classification wizard and following its associated steps in the tutorial, I then created training samples. This was perhaps the hardest part of the tutorial. Something that I had trouble with was finding the correct way to sample the samples. In other words, if i made too little samples, the data would produce errors, if I made too many samples, the data would produce errors and if I didn't cover a variety of areas for certain samples, the data would produce errors. After many trials and errors, I selected areas around the map shown in figure 3.
Figure 3: Creating Training Samples
Once my training samples were processed, I now had assigned colors per image that I classified shown in Figure 4. Although not perfect, I am pleased to see how the program was able to identify and re-assign values throughout this area within minutes.  
Figure 4 Training Sample with Assigned Values
Next, I had again use the image classification wizard to edit, snip and merge subclasses into their parent classes shown in Figure 5.
Figure 5: Assigning Subclasses to Parent Classes with Accuracy Points
Below in Figure 6, Is the Confusion Matrix as a result of the accuracy points. Shown in the bottom right hand corner, the confusion matrix has an over 92% accuracy.
Figure 6 Confusion Matrix

Conclusion

Below in Figure 7, is a map I created showing the impervious surfaces throughout the Louisville Neighborhood. Although I am currently trying to figure out a good way to label the colors, the darker the area, the more impervious the area is. Compared to satellite imagery, UAS data has the ability to better accurately map this site at a more affordable price. As you can see, areas that are water resistant such as roads and structures that are designed to contain water are the most impervious.  
Figure 7: Map of Impervious Surfaces

Tuesday, February 26, 2019

Lab 7


Part 1 of 7: Introduction to Volumetric Analysis  


If you are in the construction, mining or agriculture industry, you know that monitoring stockpile volumes is crucial to the success of your work. Professional UAV operators such as myself are utilizing UAV mapping to study faster more cost effective ways to calculate, cut, and fill volumes while improving the accuracy of traditional measurement methods. With built in measurement, editor, and extraction tools available on photogrammetry and GIS softwares, UAV data has found its niche in environments that are unique, difficult to access, or hazardous to humans. Below are tutorials on how to calculate volumes with both Pix4D and Arc Map.

Throughout this lab different operations will be utilized. Some important concepts are listed below:
  1. Create Extraction Clip Feature Class--------------------------------------------------Part 3 step 2
  2.  Perform Extract By Mask------------------------------------------------------------------Part 3 step 12
  3.  Perform Surface Volume Analysis------------------------------------------------------Part 3 step 17
  4. Resample a DSM to 10cm-------------------------------------------------------------------Part 4 step 1

Part 2 of 7:Calculating Volumes with Pix4D


The purpose of this tutorial is to demonstrate how to calculate volumes of aggregate stockpile using Pix4D software. Assuming that you have the a Pix4D file open with data saved on lab 6, click (on) ray cloud and proceed with the following steps.
  1. Under layers on the top left corner of the screen, click point cloud, but uncheck everything that is in the red box on Figure 1
    Figure 1: Model of Mine 
  2. Next, navigate to the right hand corner of the map where you can see stockpiles. Refer to Figure 2. Note you will be calculating volumetrics for a small, medium and large stockpiles. To minimize ambiguity, refer to them as Pile A, Pile B, and Pile C.
    • Figure 2: Piles A, B, and C Identified in Pix4D
  3. Now we are going to calculate the volume on  Pile A. To do this 
    • Navigate to the Pile
    • Click (on) View 
    • Click (on) Volumes 
    • Click (on) New Volume
  4. Your courser will now turn into a point marker where you can left click points around the perimeter of the base of the stockpile. When doing this, make sure you click the around the flat elevation as shown in Figure 3.
    Figure 3: Front View of Pile A before Computing Data
  5. Click (on) Compute (the stockpile will now appear red and green)
    • Click (on) Copy
    • Open up Microsoft Excel
      • Click (on) Paste to enable your data to stay in a chart as shown in Figure 4
    Figure 4: Side View of Pile A, and Copied Data to Excel
  6. Now calculate the stockpile for Pile B and C by repeating steps 2-7. 
  7. Add the results in the same excel document you will use these calculations to cross reference  calculations in Arc Map which will be discussed in Figure in the results section of this lab. While measuring, all three piles will appear similar to Figure 5.
Figure 5: Measurement of All 3 Piles Using Pix4D

Part 3 of 7: Calculating Volumes Using ArcMap

                                                                                                                                                              The purpose of this tutorial is demonstrate how to calculate volumes of stockpile using ArcMap software. Assuming that you have the ability to generate a dsm from the data in Pix4D, open it up and use the Hillshade tool to shade it. Once completed, refer to the following steps.
  1. View your Hillshade in the main window (remember how to do this from previous labs) For your reference, the Hillshade should look like Figure 6. Labeled on the figure are Piles A, B, and C
  2. Figure 6: Piles A, B, and C on Hillshade
  3. On the Catalog pane of Arc Map, you are going to Create an Extraction Clip Feature Class in order to do this, pay careful attention to the Catalog. For more information about how the Extraction Clip Feature Class Tool refer to the Pertinent Links tab here:
    • Right Click (on) wolfcreekgdb
    • Click (on) New 
    • Click (on) Feature Class 
    • Refer to Figure 7 for clarity
      Figure 7: Step 2  With Sub-steps
  4. Take a look at the UTM-Zone and do not trust it!
    • Click (on) Import
    • Go to wolfcreekgdb
    • Click (on) Add
  5. Now the correct UTM zone will appear in this case it is WGS_1984-UTM-Zone_16N
    • Click (on) Next
    • Click (on) Next
    • Click (on) Next
  6. In the New Feature Class box type in File_Name and set the Data Type as text
  7. Right Below, type Cubic_M and set the Data Type as Short Integer Refer to Figure 8 and Click (on) Finish. 
    Figure 8: Fill Out Field Name and Data Type
  8. As seen in Figure 9, Pile A appears as a Feature in Both your table of Contents and Arc Catalog
    Figure 9: Feature Class in Both Panels
  9.  Click (on) the Editor Icon which looks like this
    • Click (on) Start Editing
    • Click (on) Create Features a panel will appear
    • Click (on) Pile_A
    • Click (on) Polygon
  10. Left Click the area around Pile A the program will begin to cover the terrain as seen in Figure 10 Once you go around the entire Pile, double click 
    Figure 10: Editor Tool in Arc Map Surrounding Pile A
  11. Repeat Steps 5-9 for Pile B and C and Click (on) Save
  12. Once All piles are edited, click (on) Customize
    • make sure 3D analyst is turned on
    • Make Sure Spatial Analyst is turned on
  13. Locate the Search Bar on the Right Hand Side
    • Click (on) Extract by Mask a window will now appear
    • to to learn more about what an Extract by Mask is click here 
  14. Make sure your input raster is the appropriate dsm, and your Input raster or feature mask data is Pile_A as shown in Figure 11
    Figure 11: Ensure Appropriate Inputs
  15. Name the new file Pile A_Clipped and save it to the wolfcreek geodatabase. Remember, its is highly recommended to save the Clip to the geodatabase!
    • Click (on) Save
    • Click (on) Ok
  16. Turn off the shading, and turn off Pile A
    •  you will now see the pile is clipped
    • Click (on) the Information Icon and note the elevation to be around 293 as seen in Figure 12
      Figure 12: Clipped Pile A with Information Value
  17. Repeat Steps 12-15 For Pile B and C
  18.  Now we are going to perform a Surface Volume Analysis. In order to do this, go back to Pile A To learn more about what a Surface Volume Analysis does refer to the Pertinent Links Section which can be found here: 
    • Click (on) Search
    • Type in Surface Volume
  19. For your input Surface, select PileA_clipped
  20. Click (on) Open
    • Name the File Pile A_info
    • Make sure the Output Text File is correct
    • Set the Plane Height to value found in the information tool seen in Figure 12
    • Click (on) Ok refer to Figure 13 for clarity
      Figure 13: Step 19

  21. Repeat Steps 17-19 For Piles B and C

Part 4 of 7: Re-sampling a Raster Data set to a new Pixel Size


For this skill you must be able to create an extraction clip, be able to extract by mask and be able to perform a surface volume analysis. To learn more about what Re-sampling a Raster Data set to a new Pixel Size does, click here: Once you have mastered that, (assuming you have data similar to this lab) refer to Figure 13 and follow the example tutorial. 
  1. Locate your clipped file
    • click (on) properties
    • note the cell size as demonstrated in Figure 14 
      Figure 14: Cell Size of DSM
  2. Although the cell size is 0.019, we want it to be 0.01 exactly. We want this because when we compare this to a DSM with aggregate removed over time, we need to make sure the pixel sizes match. Therefore, we are re-sampling a raster data set to a new cell size that way we can accurately calculate the different volumes of the stockpile. In my lab, I made 3 different clips for a stockpile on August 27th, September 30th and July 22nd. If you would like to see the figures for those, go to Part 5. if you would like to see the method how this was achieved, follow the rest of the steps.
  3. Go to the data search engine on the right hand side of your screen and type in resampling
    • specify the input raster of your clipped file 
    • make sure the output data set is in a geodatabase and when saving, name the file with a 10cm at the end of it to distinguish the raster
    • Click (on) Save
    • For your X and Y values, type in .10
    • Click (on) ok 
    • Refer to Figure 15
      Figure 15: Resampling Tool

Part 5 of 7 :Discussion Volumetric Results Using Pix 4Dmapper and Arc Map


In Figure 16 are volumetric calculations obtained from Pile A, B, and C using Pix4Dmapper. As you can see Pix4D displays different values compared to Arc Map pictured in Figure 17. Although the class is not completely certain why, it is believed that Pix4D's calculations are incorrect because the spherical camera used on the UAV was not supported for the Pix4D, the terrain area was poorly defined, or the parameter selections were off. As a result, this software processed incorrect data.

Nevertheless had Pix4D calculated the data correctly, someone knew to calculating vol-metric  data would have less trouble learning to use Pix4D compared to ArcMap. Although ArcMap has more to options and tools to siftthrough data with, it takes a long time to learn, and online tutorials in English are not easy to find. Nevertheless, further research and learning about these two softwares will be covered in this class.
Figure 16: Volumetric Calculations used in Pix4Dmapper
In Figure 17 are the calculations obtained from Pile A, B, and C but used with Arc Map
Figure 17: Volumetric Calculations used in Arc Map

 Part 6 of 7: Analyzing the Volume of a Stockpile Over Time

In this section, we were tasked with calculating volumetric data of a stockpile from July22nd through September 30th. (see dates in key metadata) Figures 18, 19, and 20 display maps of the three time periods. Notice the the volume listed three lines below the map title. As you can tell, there was an overall net loss between July and September but you can see that there was a gain between July and August. When comparing these maps, note that I could have snipped less elevation around the pile which would have resulted in more accurate results. Nevertheless these calculations demonstrate the capability a UAS has for taking large stockpile measurements.

Figure 18: July 22nd

Figure 19: August 27th
Figure 20: September 30th

Part 7 of  7 Conclusion


Throughout this lab, we utilized several geoprocessing tools along with two geodatabases in order to construct, compare, and contrast stockpile calculations. In figure 21, I created a map showing elevation exaggerations of stockpiles A, B, and C which can be referenced in Figure 6 as well. To wrap up the rest of the exercise I included a video of how UAS is applied to stockpile measurement here: 

Figure 21: Map of Wolfpaving Stockpiles A, B, and C

Sunday, February 24, 2019

Pix4D vs Drone Deploy for Construction Applications

For this UAS Geospatial Science class, we have been using Pix4D with Esri Products. With these two packages combined, we have learned about cost effective ways to maximize the performance of a UAV, and show how the data can pay for itself. Nevertheless, I think it is important to look into other products such as DroneDeploy especially when mapping out construction sites. Because DroneDeploy focuses heavily on construction applications, some say it is superior in the construction industry compared to Pix4D.

Although this can be true when sharing interactive maps with clients. Pix4D enables you to map sites without internet and is better known for accuracy. Nevertheless, Drone Deploy does a fantastic job at providing deliverables depending on the type of mission sensor, type of UAV, and other key metadata that are essential to the user's needs. In both Figures 1 and 2, I have provided videos of both Pix4D and Drone Deploy for construction applications. If you have any questions about what other capabilities the softwares can offer, feel free to contact me.

Figure 1: Pix4D Video
Figure 2: DroneDeploy Video