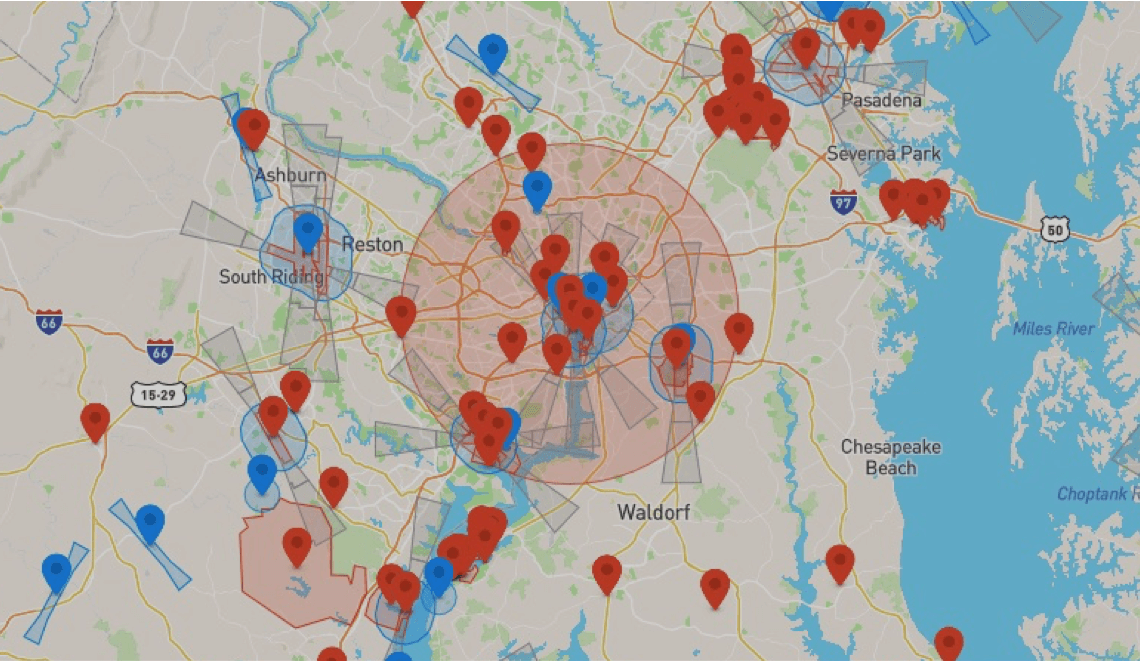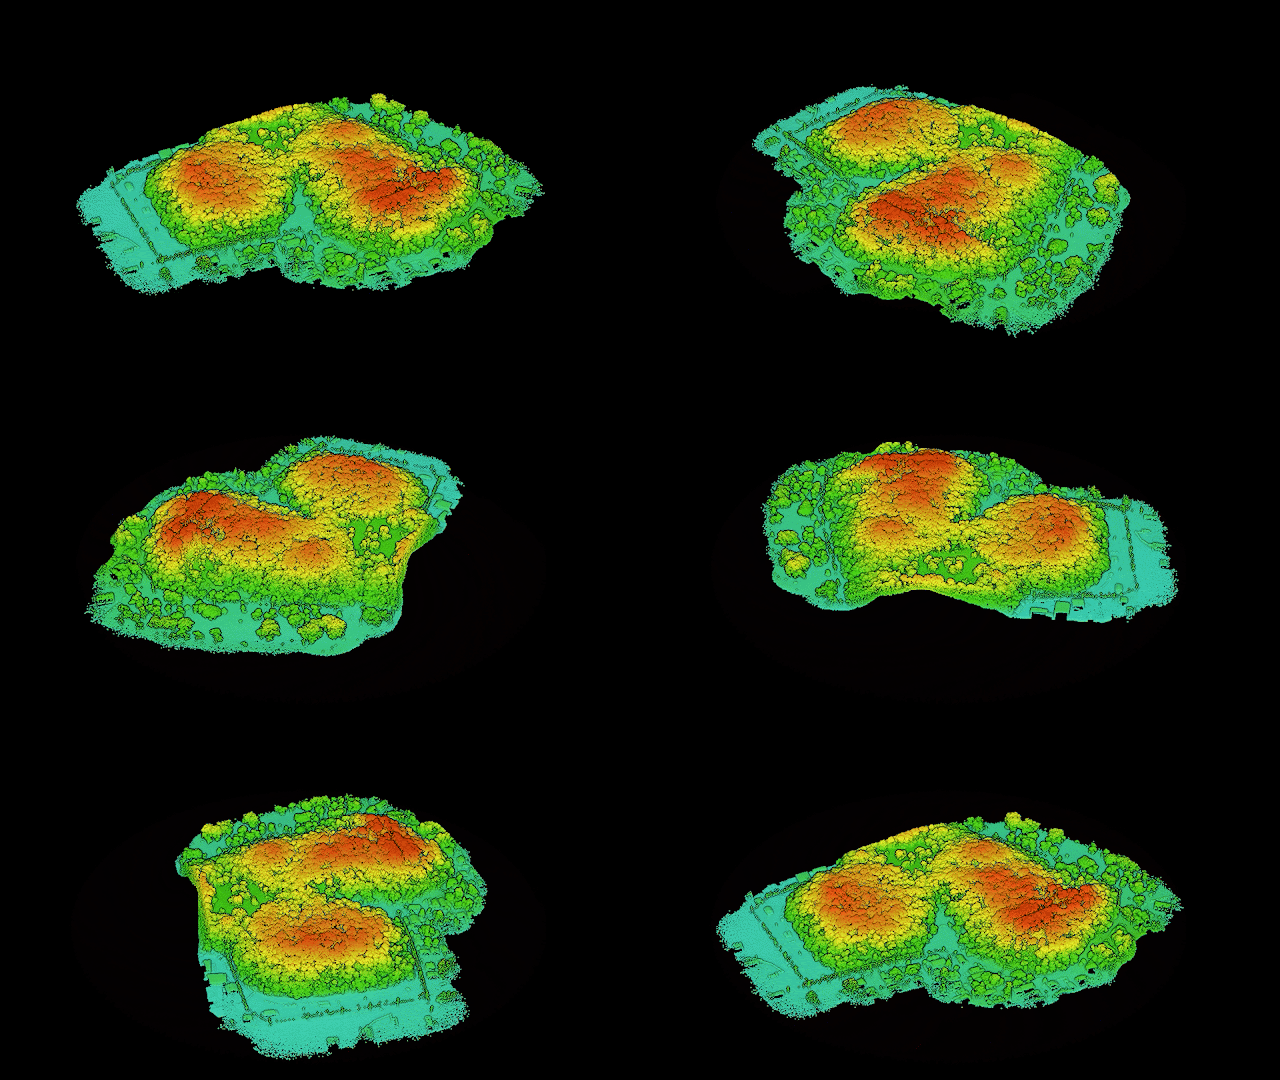
Wednesday, August 16, 2023

FLIR Thermal Studio Pro

Looking at UAS Imagery in FLIR Thermal Studio Pro 
Overview
FLIR Thermal Studio Pro, developed and managed by Teledyne FLIR LLC, is a software solution that facilitates the processing and analysis of thermal data gathered through FLIR products. While some of FLIR's products are  designed to integrate with handheld cameras, I have discovered that Thermal Studio Pro provides immense value in analyzing and processing our UAS imagery. Through this post, I aim to demonstrate a few techniques I have used with Thermal Studio Pro to analyze the conditions of bridge decks, utilizing the powerful tools that the software offers

Teledyne FLIR Advantages
As a frequent user of the Zenmuse XT2, I utilize it for various infrastructure inspections. FLIR provides numerous tools that are available for free download which can be found here. If you're unsure about the potential benefits, you can easily access their software here. However, please note that although the tools are free, the generated information is watermarked and cannot be practically utilized. Additionally, the free trial software has no limitations.

Teledyne FLIR Difficulties
Unfortunately, not all the tools available on FLIR's trial software are functional. When I reached out to tech support regarding the panorama tool, they informed me that it is only accessible with the purchase of Thermal Studio Pro. I am extremely disappointed with their customer service, as the lack of access to the panorama tool may render my year subscription fee useless. FLIR has made no attempt to provide me with a temporary license to test the compatibility of the panorama tool with my data. Please refer to Figure 1 to observe the lack of response 

Figure 1: Teledyne FLIR's Customer Service 

Features for UAS Inspections 
As a novice user of FLIR Thermal Studio Pro, I find the following features to be useful for thermal deck inspections:
       • Temperature Profile
       • Color Pallet Tools
       • Box Annotation
       • Temperature Spot meter

Bridge Deck Case Study 
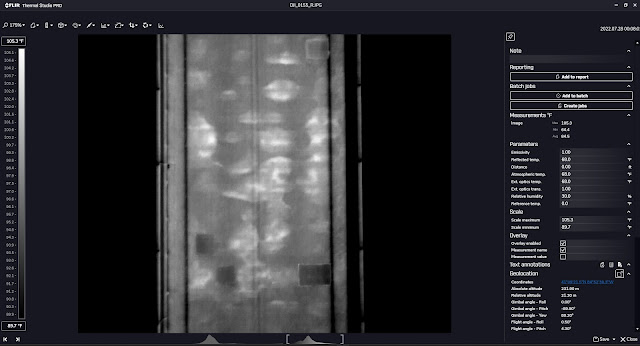
To inspect bridge decks, we use a UAS equipped with the XT2 camera to capture sections of the decks from above. When imported to Thermal Studio Pro, the unedited file appears in black and white (Figure 2). To identify areas of concern, we use the temperature profile tool to adjust the temperature variance and better define the boundaries of bright spots (Figure 3).

Figure 2: Unedited Thermal R_JPEG File Looking at Bridge Deck
Figure 3: R-JPEG File with Profile Adjustment Looking at Bridge Deck

Next, we use the color palette tool to assign more colors to temperature and identify hotspots of concern (Figure 4). To exclude irrelevant data, we use the box annotation tool to draw a box around the area of interest (Figure 5).While we are less concerned with temperature, we can use the spot meter tool to verify the data and ensure consistency. If any patch is warmer than 95 degrees F, it is more likely to be deficient. 

Figure 4: R-JPEG File with Color Pallet Looking at Bridge Deck
Figure 5: R-JPEG File with Spot Temperature Tool Looking at Hotspots on Bridge Deck 
Figure 6: Example Diagram of Visual and Thermal Imagery of Bridge Deck 
Tools I am Troubleshooting
We can also create a comparison diagram using FLIR Thermal Studio Pro to combine visual and thermal imagery (Figure 6).However, I find it challenging to create reports using FLIR's template, and the panorama tool doesn't seem to work with the XT2 camera despite numerous attempts with 85+ overlap. As FLIR doesn't allow a trial of the panorama tool, I'm not sure if it's compatible with the camera. Despite this, I'm still trying to use the tool.

Conclusion
I am generally satisfied with Thermal Studio Pro's performance and functionality. The software has proven to be a valuable tool for conducting UAS and infrastructure inspections, allowing me to quickly analyze and interpret thermal data in a comprehensive manner. However, their panorama tool and customer service could be better. 

Saturday, April 29, 2023

Combatting DJI Security Risks: The DroneSense Solution

Introduction
The drone industry has experienced significant growth in recent years, with the Federal Aviation Administration (FAA) predicting over 835,000 commercial drones in the United States by 2024. DJI Unmanned Aerial Systems (UAS) have become widely popular in public safety applications, but recent security concerns and vulnerabilities have raised alarms in the industry. This blog post will discuss these security concerns, a recent Chinese drone ban in Florida, and DroneSense's new communication device designed to address these issues and improve drone security.

DJI Security Concerns and Vulnerabilities
While DJI drones have proven to be valuable tools in public safety, their security vulnerabilities have become a point of concern. Several reports have identified weaknesses that could allow users to modify crucial drone identification details, such as serial numbers, and even bypass tracking security mechanisms. These vulnerabilities pose a significant risk to both drone operators and the public.

Recent Event: Chinese Drone Ban in Florida
In response to these security concerns, some jurisdictions have taken action. Florida recently enacted a ban on Chinese drones, further highlighting the need for secure drone solutions in the public safety sector. This move underscores the importance of addressing these vulnerabilities to maintain trust in the growing drone industry.

DroneSense's Solution
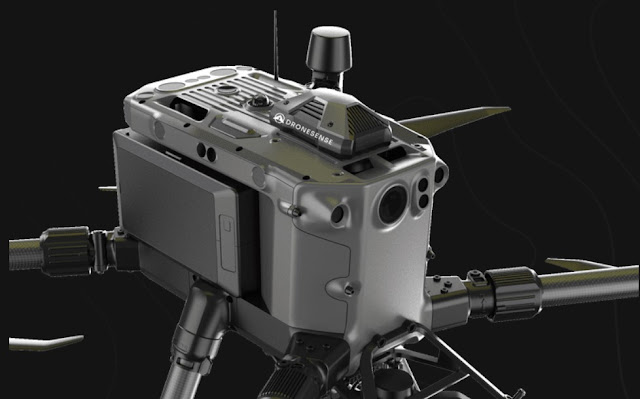
DroneSense, a company specializing in drone software, hardware, and professional services for first responders, has developed a new communication device to help mitigate security concerns associated with DJI drones. This device pictured in Figure1 is designed as an add-on for public safety drones and prevents information leakage to the drone manufacturer.

Figure 1: Dronsesnse Module Mounted on DJI Matrice 300 Airframe

Key Features of DroneSense's Device
Referecing Figure 2, the new communication device offers several security and operational features, including First Responder traffic prioritization, 4G/5G data connectivity, secure real-time live streaming, and end-to-end 256-bit data encryption. By implementing these features, DroneSense aims to provide public safety agencies with a more secure and reliable drone solution.

Figure 2: Dronesense Features 

Device Mounting and Compatibility
DroneSense's communication device securely mounts to the airframe of various drone models using industrial-grade fasteners. This secure attachment ensures compatibility and reliability during flight operations.

Benefits for BVLOS Flights and More
The device offers several benefits for beyond visual line of sight (BVLOS) flights, altitude limits, no-fly zones, and emergency landing sites. By leveraging 4G/5G networks and adding onboard intelligence, the device can improve the safety and functionality of public safety drone operations.

DroneSense's Commitment to Data Security
DroneSense remains dedicated to supporting public safety and first responders while addressing security concerns. Their new communication device, compatible with multiple drone hardware devices and planned for expansion to non-drone platforms, is expected to be available in late 2023.

Conclusion
The growing importance of drone technology in various industries highlights the need for secure and reliable solutions. DroneSense's new communication device addresses security concerns associated with DJI drones and offers a promising solution for public safety agencies. For more information, visit the DroneSense website at discover.dronesense.com/onboard. 

Citations 

DroneSense. (n.d.). Onboard: Real-time Telemetry and Video Streaming. DroneSense. Retrieved April 29, 2023, from http://discover.dronesense.com/onboard/

Horvath, I. (2023, April 12). DroneSense unveils DJI drone addon device for real-time telemetry and video streaming. DroneDJ. Retrieved April 29, 2023, from https://dronedj.com/2023/04/12/dronesense-dji-drone-addon-device/

Horvath, I. (2023, April 5). Florida's Chinese drone ban could hurt search and rescue operations. DroneDJ. Retrieved April 29, 2023, from https://dronedj.com/2023/04/05/florida-chinese-drone-ban/

Friday, April 28, 2023

Computer Considerations for UAS Operations

Overview
Photogrammetry holds a vital position in Unmanned Aerial Systems (UAS), facilitating the development of precise 3D point ckouds and maps using aerial imagery. This blog post concentrates on the optimal computer specifications for operating Pix4D photogrammetry software, a prevalent option within the industry. Alternatives such as Agisoft PhotoScan, DroneDeploy, and Bentley ContextCapture will be mentioned. Below is a table I created that beiefly categorizes different tiers of computer considerations which can help process data derived from photogrammetric UAS operations.

Table: Tiers of Computer Systems for Photogrammetric Processing

Considerations
In addition to the specifications mentioned in the table, remember to consider additional features such as remote desktop connection access, portability, durability, and CPU protection while selecting a computer  for UAS photogrammetric projects. While Pix4D is the primary focus of this guide, other photogrammetry software options have similar requirements. Agisoft PhotoScan, DroneDeploy, and Bentley ContextCapture all demand powerful processors, ample memory, and dedicated graphics cards to function effectively. However, there may be some differences in terms of compatibility and performance with specific hardware components.

Conculsion
Selecting the right computer for photogrammetry software in Unmanned Aerial Systems depends on your budget, performance requirements, and additional features like remote desktop access and portability. The three tiers presented in this guide should provide a solid starting point for your search. Remember to consider your specific needs and the demands of the software you plan to use, and invest in a computer that meets or exceeds these requirements to ensure smooth operation and optimal results.

Citations

Essential Photogrammetry Terms for UAS


Overview
Photogrammetry is a technique used to derive accurate measurements and create detailed 3D models of real-world objects or landscapes by utilizing multiple photographs. The advent of Unmanned Aerial System (UAS) technology has significantly increased the importance of photogrammetry, especially when executed correctly with specialized photogrammetry software. The aim of this post is to review essential photogrammetry terms that are commonly used in Pix4D, but can also be applied to general UAS photogrammetric operations.

Photo Overlap 
Referecning Figure 1, photo overlap is the amount of shared area between adjacent images captured during a drone flight plan. Adequate photo overlap is crucial for ensuring that photogrammetry software can accurately stitch images together. Generally, photo overlaps between 60% and 90% are considered suitable. However, the ideal value can vary depending on the type of area being captured. For instance, when using the Zenmuse X/7 sensor from DJI, I typically aim for an 80% overlap especially since most of the envorinments that I capture include moderate to heavy vegetation. It's important to note that high photo overlap may become less effective and more time to process, but this can also depend on the specific circumstances.

Figure 2:Example of Photo Overlap

Geometry
Geometry is the study of shapes, sizes, and positions of objects in space. In photogrammetry, geometry plays a crucial role in determining items such as camera gocal length, image orientation, image mtching, triangulation, surface reconstruction, and coordinate system transformation . Drone images captured at different perspectives are used to reconstruct the geometry of the scene, ultimately producing a 3D model. Referencing Figure 3 is an example of a colinear characteristics from geometry. 

Figure 3: Colinear characteristics from geometry
Radiometry
Radiometry is the science of measuring electromagnetic radiation, including visible light. In photogrammetry, radiometry is essential for capturing accurate color and brightness information from images. The radiometric quality of an image affects the accuracy and quality of the final photogrammetric product. Radiometric corrections are used to remove inconsistencies caused by variations in the intensity of light, atmospheric conditions, and other factors that can affect the quality of the images. This is particularly important when using photogrammetry to create 3D models or maps of large areas because any inconsistency in the images can result in errors in the final product. See Figure 4 for a radiometry diagram
Figure 4: Radiometry Diagram
Triangulation
Referenced in Figure 5, triangulation is a process in which the position of a point is determined by measuring angles from known reference points. In photogrammetry, triangulation is used to determine the position of objects in 3D space using overlapping images. This process is crucial for creating accurate and detailed 3D models and maps.
Figure 5: Triangulation
Internal and External Parameters
Depicted in Figure 6, internal parameters refer to the characteristics of the camera used to capture images, such as focal length, sensor size, and lens distortion. External parameters include the position and orientation of the camera relative to the object being photographed. Both internal and external parameters are crucial for accurate photogrammetric processing.

Figure 6:
Figure 6:Internal Pararmaters 
Initial and Computed Parameters
Initial parameters are the approximate values of internal and external parameters, typically estimated using metadata from the drone and camera. Computed parameters are the refined values obtained through photogrammetric processing. Accurate computed parameters are essential for generating high-quality 3D models and maps.

Real-Time Kinematic
(RTK) is a GPS-based technology for UAS (Unmanned Aerial System) operations. By utilizing a network of reference stations, it corrects the GPS signal errors in real time, enhancing positional accuracy to centimeter levels. RTK enables precise navigation, improves flight stability, and increases the efficiency of UAS operation. The technology also allows for safer and more reliable operations in complex environments. RTK typically costs more compared to traditional GPS systems. Click on the video below for a video summarizing RTK. 
Post-Processed Kinematic
PPK, combines GPS data from both the drone and a base station, enabling precise determination of the drone's position during flight. The collected data is processed after the flight, correcting any errors and refining positional information. This results in high-precision maps and 3D models,. PPK's main advantage is its ability to deliver centimeter-level accuracy without requiring real-time data transmission.

Coordinate System
A coordinate system is a standardized method of representing the position of points in space. In UAS related mapping, coordinate systems are essential for defining the location and orientation of objects and images accurately. The Universal Transverse Mercator (UTM) and the World Geodetic System (WGS84) are commonly used coordinate systems in photogrammetry. The specific coordinate system used may vary depending on the location, but typically, I use the state plane coordinate system unless there is a request for something else. To learn more about coordinate systems, click on the video below.
Tie Points
Tie points are identifiable features that are visible in multiple overlapping images and depicted in Figure 7 which was taken from a point cloud I created using Pix4D. Photogrammetry software uses tie points to establish relationships between images, align them accurately, and reconstruct the 3D geometry of the scene. The quality and quantity of tie points are essential for generating accurate and detailed 3D models and maps. 
Figure 7: Looking at Tie Points Note Number of Images Accociated With Green Ray
Ground Sampling Distance (GSD)
GSD is a measure of the distance between two consecutive pixel centers on the ground, representing the smallest object that can be distinguished in an image. Referenced in the video below at 9:30 lower GSD values indicate higher image resolution and detail. GSD is influenced by factors such as camera sensor size, focal length, and flight altitude. 

Volume Measurement
A volume measurment used to estimate the volume of objects or features, such as stockpiles, excavations, or earthworks. By creating a 3D model of the object or area, photogrammetry software can accurately calculate the volume, providing valuable data for project planning and management. Figure 8 depictes a volume measurement taken by data I captured with the DJI M210 Zenmuse X/7.
Figure 8: Example of Volume Measurment of Point Cloud
Absolute Accuracy
Absolute accuracy refers to the degree of closeness between the measurements or positions derived from photogrammetric processes and their true or actual values in the real world. In other words, it is a measure of how accurately the photogrammetric data, such as point coordinates or feature measurements, represents the true physical locations of the objects or features being measured.

Relative Accuracy
Relative accuracy measures the consistency of distances, angles, and positions between objects within the photogrammetric model. High relative accuracy is crucial for creating accurate 3D models and ensuring that the spatial relationships between objects are maintained. To reinforce the concept of absolute and relative accuracy, refere to the video below.
Structure from Motion
(SfM) is a photogrammetric technique that reconstructs 3D structures from a sequence of 2D images by analyzing the motion of the object or camera. It involves feature extraction, matching, camera pose estimation, and point cloud generation to create an accurate 3D mode. For a great explanation of structure from motion, visit the video below. 

Root Mean Square Error
(RMSE) which is depicted in Figure 9,  is a statistical measure used to quantify the average deviation between predicted and observed values. In the context of Unmanned Aerial Systems (UAS), it assesses the accuracy of measurements like position or elevation compared to ground truth data. Lower RMSE values indicate better accuracy, while higher values suggest larger discrepancies between the UAS measurements and the reference values.
Figiure 9: Note RMSE
Ground Control Points
Referenced in Figure 10, (GCPs) are easily identifiable, well-defined, and accurately surveyed reference points on the Earth's surface that are used to improve the geolocation accuracy and precision of aerial imagery captured by drones or other remote sensing platforms.
Figure 10: Example GCP Targets
Digital Elevation Model
(DEM) in UAS is a digital representation of the Earth's surface or terrain that is created using elevation data collected by aerial sensors mounted on unmanned aerial vehicles (UAVs), It displays the elevation information as a grid of cells  where each cell corresponds to a specific area on the ground and has an associated elevation value. A DEM can include above ground features. See Figure 11 for details.

Digital Terrain Model 
A DTM is a specific type of DEM that focuses on the bare ground surface, excluding above-ground features.

Digital Surface Model 
A (DSM) in the context of  refers to a 3D representation of the Earth's surface that captures both natural and man-made features, including buildings, vegetation, and terrain. See Figure 11 for details.
Figure 11:Difference Between DSM, and DTM

Conclusion 
By comprehending this list of terms, you will gain a deeper understanding of the quality of photogrammetric data derived from Unmanned Aerial System (UAS) technology. The terminology described is not limited to Pix4D users but is also relevant to general UAS photogrammetric operations. If you think there are any additional terms that should be included, please feel free to share your suggestions.

Citations
Pix4D. (2023, April 28). Ten Basic Terms of Photogrammetry Knowledge. Pix4D Blog. https://www.pix4d.com/blog/ten-basic-terms-photogrammetry-knowledge/

Plex.Earth Support. (n.d.). Elevation Modeling: the differences between DTM, DSM, & DEM. Retrieved April 28, 2023, from https://support.plexearth.com/hc/en-us/articles/4642425453201-Elevation-Modeling-the-differences-between-DTM-DSM-DEM

Sunday, April 16, 2023

The Impressive Concept of GET Wireless Charging for Enterprise UAS

Regrettably, a majority of the cost-effective enterprise unmanned aerial systems (UAS) currently available in the market are bound by a maximum flight duration of approximately 30 minutes. This inherent restriction poses a considerable hindrance to the success of missions that demand a substantial investment of energy, time, and perseverance. While the notion of the future technological advancements in wireless technology fills one with optimism, the reality remains that the GET wireless charging solution for UAS is an impressive and promising concept that warrants attention and can be found in the follwing video.

Overcoming Geofencing Challenges with DJI Drones


KSBN Case Study

For a mission taking place less than half a mile from South Bend's International Airport, I had to implement numerous safety measures to ensure that the unmanned aerial system (UAS) would not interfere with any nearby manned aircraft operations. After submitting a comprehensive mission plan, risk assessment matrix, and coordinating with local entities, I obtained a waiver permitting me to fly at a ceiling of 50 feet above ground level (AGL) to inspect two bridge decks using a DJI M210 and an XT2 camera. While using the DJI UAS, the operating location appeared to be outside DJI's restricted geofence zone, as shown in Figure 1. However, upon arriving on site, the aircraft incorrectly indicated that I was in a no-fly zone.

Figure 1: False Lock at Operation Location Outside of Restricted Zone

What did I do?

Fortunately, I had downloaded a custom unlock from DJI's website before arriving on site. Although the custom unlock feature worked, I was concerned by the discrepancy between DJI's geofence map and the real-time location. If I had relied solely on DJI's geozone map and not unlocked the aircraft, the mission would have failed, as I would have missed the 30-minute window I had to fly.

What did I Learn?

Although DJI's geofence is an essential safety tool, the aircraft's real-time location may sometimes trigger a false lock. If you are not familiar with DJI's unlocking process, you may experience a significant disruption for no valid reason. DJI claims that you can unlock your drone as long as you are connected to the internet; however, I was unable to do so with the M210 RTK V2, despite having a full internet connection and the tablet indicating that the unlock was verifying.

Conclusion 

If you have a DJI aircraft and have permission to legally operate in a zero grid, make sure that you know how to unlock in case you end up in a situation like mine. Also know that in the unlocking process, your aircraft will be set at an altitude from the takeoff point, so consider that when selecting a takeoff location ahead of time. 

Sunday, April 2, 2023

Adobe Lightoom Photo Merge


Overview
Adobe Lightroom is an image organization software that allows you to stitch, edit, and manipulate photos. In this post, you will learn how I use Lightroom to merge photos of large structures like bridges.

The Need for Merged Photos 
Due to restrictions on altitude when capturing images with aircraft like the DJI M210, I often need to fly far away and capture oblique photos rather than nadir photos. Oblique photos can be stitched together to create a more detailed image, hence the need for merged photos.

Alternatives to Merging Photos 
While photogrammetry platforms like Pix4D can be used to create an Orthomosaic, I found Adobe Lightroom to be a more straightforward and efficient alternative. Lightroom is particularly useful when dealing with projects that include water.

Why Adobe Lightroom?
I found adobe lightroom to be fairly easy to merge photos compared to Pix4D. Many projects I fly include water and as of this post, Lightroom has done well with fewer distractions in my experience. 

A Case Study with the DJI Zenmuse XT2
The XT2 camera captures both visual and thermal images and is compatible with the DJI Matrice 200 and 300 series. To scan infrastructure like bridge decks, I take a series of thermal photos and visual photos. The visual photos are used to map the structure and serve as comparison photos to the thermal images.

After importing the 47 visual photos captured by the XT2 into Lightroom (see Figure 1), I select all the photos and click the Perspective Merge function (See Figure 2). The photos take about a minute to process. Refereencing Figure's 2 and 4, the Boundary Wrap function helps correct the fisheye distortion common with the XT2 camera, and any remaining lens distortion can be corrected using open-source software or Adobe Photoshop.

Figure 1: 47 Photos Loaded to Adobe Lightroom
Figure 2: Perspective Merge Function
Figure 3: Merge Before Applying Boundary Wrap
Figure 4: Merge After Applying Boundary Weap
Results of Stitching Images From the XT2 
Referencing Figure 5,the results of stitching images from the XT2 show a bridge with one truck photo bombing it. Although the image quality decreases when zoomed in, this is due to the XT2's 12-megapixel camera, which is not designed for cinematography. The barrier wall on the right side is not perfect and could be improved in Photoshop, while the left barrier wall appears even.
Figure 5: Distortion Correction Settings in Adobe Photoshop
Figure 6: Merged Imagery From Zenmuse XT2
Conclusion 
Considering that we capture numerous thermal images at low elevations, the visual reference photos can further enhance the overall assessment by facilitating structural mapping. For sizable structures, this approach proves particularly advantageous, as it allows for preliminary reference mapping using the visual imagery without exceeding the 400 ft limit or needing to unlock the M210.

Saturday, March 25, 2023

Does Entry Level LiDAR Offer Value?

Looking at LiDAR Point Cloud Collected by L1 and Generated in DJI Terra

Overview 
Last year, I had the chance to rent a DJI Matrice 300 RTK and test its L1 LiDAR sensor (Figure 1). The L1 is DJI's first commercial LiDAR system, and its affordability caught my attention. Although I'd love to operate a $100,000+ cm survey-grade accurate LiDAR system, my current resources don't allow me to afford such an expensive system. Additionally, renting a survey-grade LiDAR is significantly pricier than renting an entry-level LiDAR.  
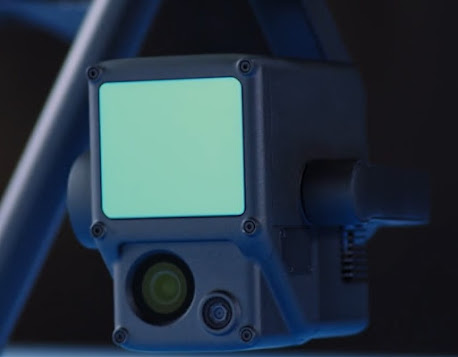
Figure 1: DJI L1

The point clouds generated by this system were impressive, particularly in areas with dense vegetation. However, visually pleasing point clouds are useless if we can't use them! This post aims to share my experiences with the L1, helping you better understand what it takes to make entry-level LiDAR work.. 

What is Entry Level LiDAR?
There is no definition of entry level LiDAR but I have classified the L1 an entry level LiDAR system because in my opinion, although it is not a survey grade LiDAR system, many people will purchase it as their first LiDAR UAS due to it’s simplicity, availability and affordability. Is it possible to obtain survey grade data using the L1? Since I am not a licensed surveyor, I shouldn’t answer that question, however I believe so. 

Nevertheless, I do not think the L1 will provide survey grade results in an accurate and repeatable way unless you are extremely careful in selecting the correct settings, planning the correct missions, and correctly integrating traditional survey data to the correct software. Here is a question for you, are the $150,000 survey grade LiDAR UAS user friendly? I assume user friendly enough to stay in business, but I ask this because  many seem to require hardware and software training. 

DJI Terra the Good, the Bad, the Ugly
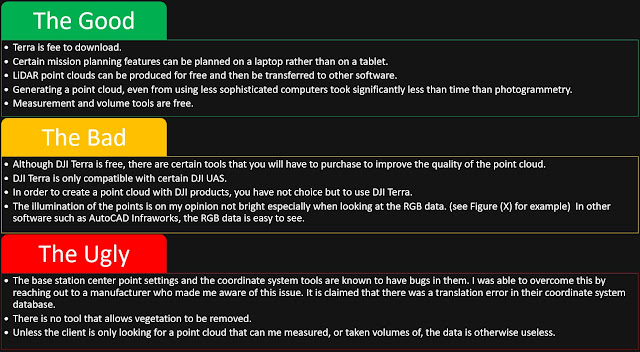
Referencing DJI’s website, DJI Terra is a PC application software that mainly relies on 2D orthophotos and 3D model reconstruction, with functions such as 2D multispectral reconstruction, LiDAR point cloud processing, and detailed inspection missions. Released in 2020, DJI Terra is an alternative to other photogrammetry platforms such a Pix4d, Drone Deploy, Context Capture etc.. Figure 2 is a link to DJI Terra, while Figure 3 details items that I think are good, bad and ugly regarding DJI Terra and it's capabilities. 
Figure 2: Link to DJI Terra 

Figure 3: DJI Terra- The Good, The Bad, and The Ugly 

Visualization and Entry Level Tools 
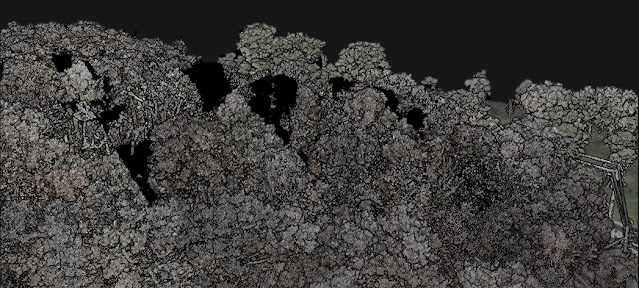
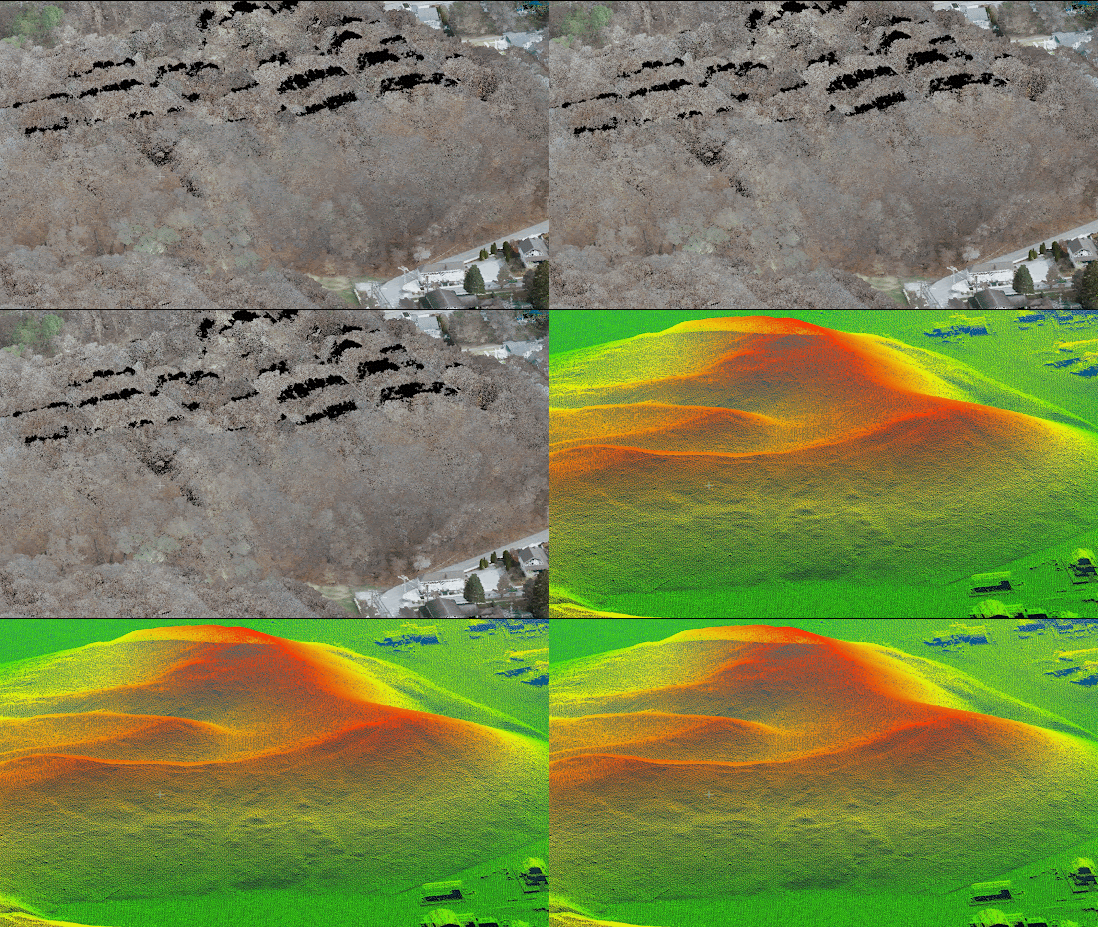
As seen in Figure 4, DJI Terra displays points by RGB values, Height, Return, and Reflectivity. Once populated, the user can zoom into features of interest. One of my first concerns while viewing the RGB settings was the occasional dark spots along a tree line (Figure 5).
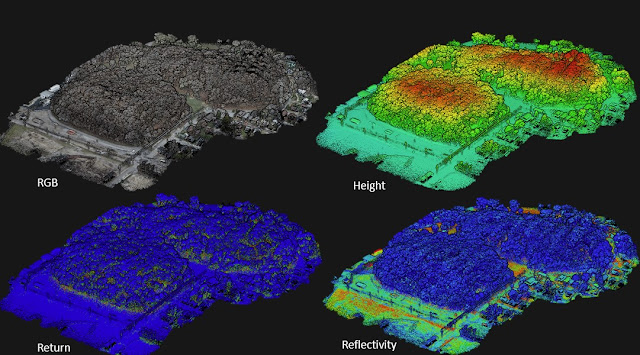
Figure 4: Point Displays in DJI Terra

Figure 5: Spots where Photogrammetry Colorization was Missed 

The dark spots are areas missed by the connected photogrammetry camera within the L1 unit. If this was a photogrammetry point cloud, the dark spots would represent missing data. Since the purpose of photogrammetry in this case is to colorize the LiDAR point cloud rather than construct a surface no actual "holes" were noted as confirmed in Figure 6. However, missing colors could be a major disadvantage if you rely on a colored point cloud to identify features.
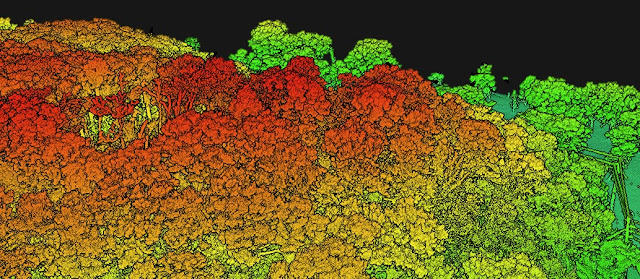
 
Figure 6: Points Classified by Elevation Have no Dark Spots

In Figure 7 larger pavement markings could be identified, but items such as curb boundaries and ground lines are difficult if not impossible to identify. If you need to make break lines in your projects, it is likely your data from the L1 will not help you. Aside from basic measurement tools, coordinate system tools, and a volume tool, more can be done with the L1 data if you have access to other data analysis software. 
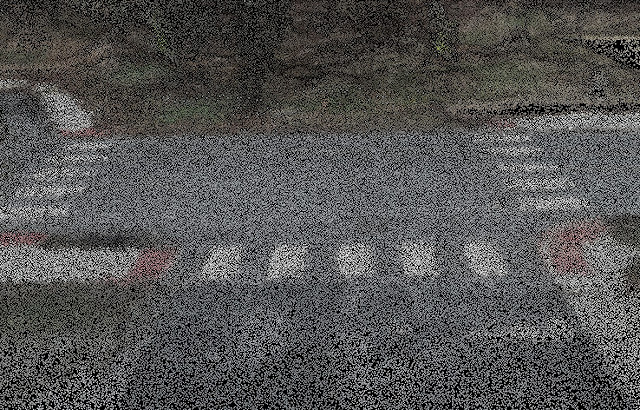
Figure 7: Looking at Pavement Markings 

How DJI Terra Compares to Other Software
Pun not intended; Cloud Compare is a free open-sourced point cloud processing software which can help analyze data from the L1 significantly more than DJI Terra., Below are functions I have been able to achieve using cloud compare:


    • Reducing the file size of the point cloud
    • Trimming excess data from the point cloud 
    • Generating surfaces
    • Generating contours
    • Removing vegetation 

In Figure 8, the L1 data is shown in Cloud Compare. One immediate observation is that the RGB display in Cloud Compare appears brighter and clearer than in DJI Terra's interface. Despite this advantage, however, the RGB point display from the L1 still presents challenges when it comes to identifying objects.
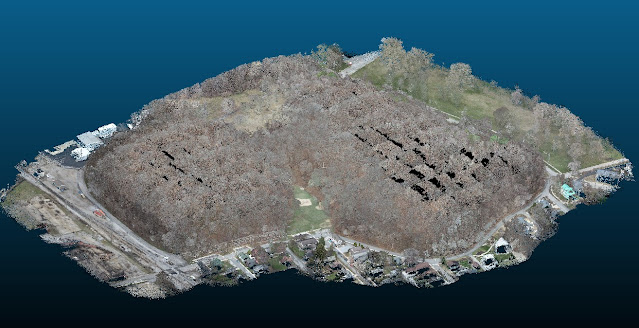
Figure 8: L1 Data Using Cloud Compare 
Data Analysis 
To assess the quality of LiDAR data, one useful approach is to check for any gaps or holes that may be hidden beneath the vegetation. Although I cannot disclose all the intricacies of LiDAR data analysis, my workflow allows me to eliminate vegetation without discarding the essential data required for surface generation. In Figure 9, you can see the point cloud with the vegetation removed and the ground points color-coded by height. For a closer look at the vegetation removal, please refer to Figure 10. 
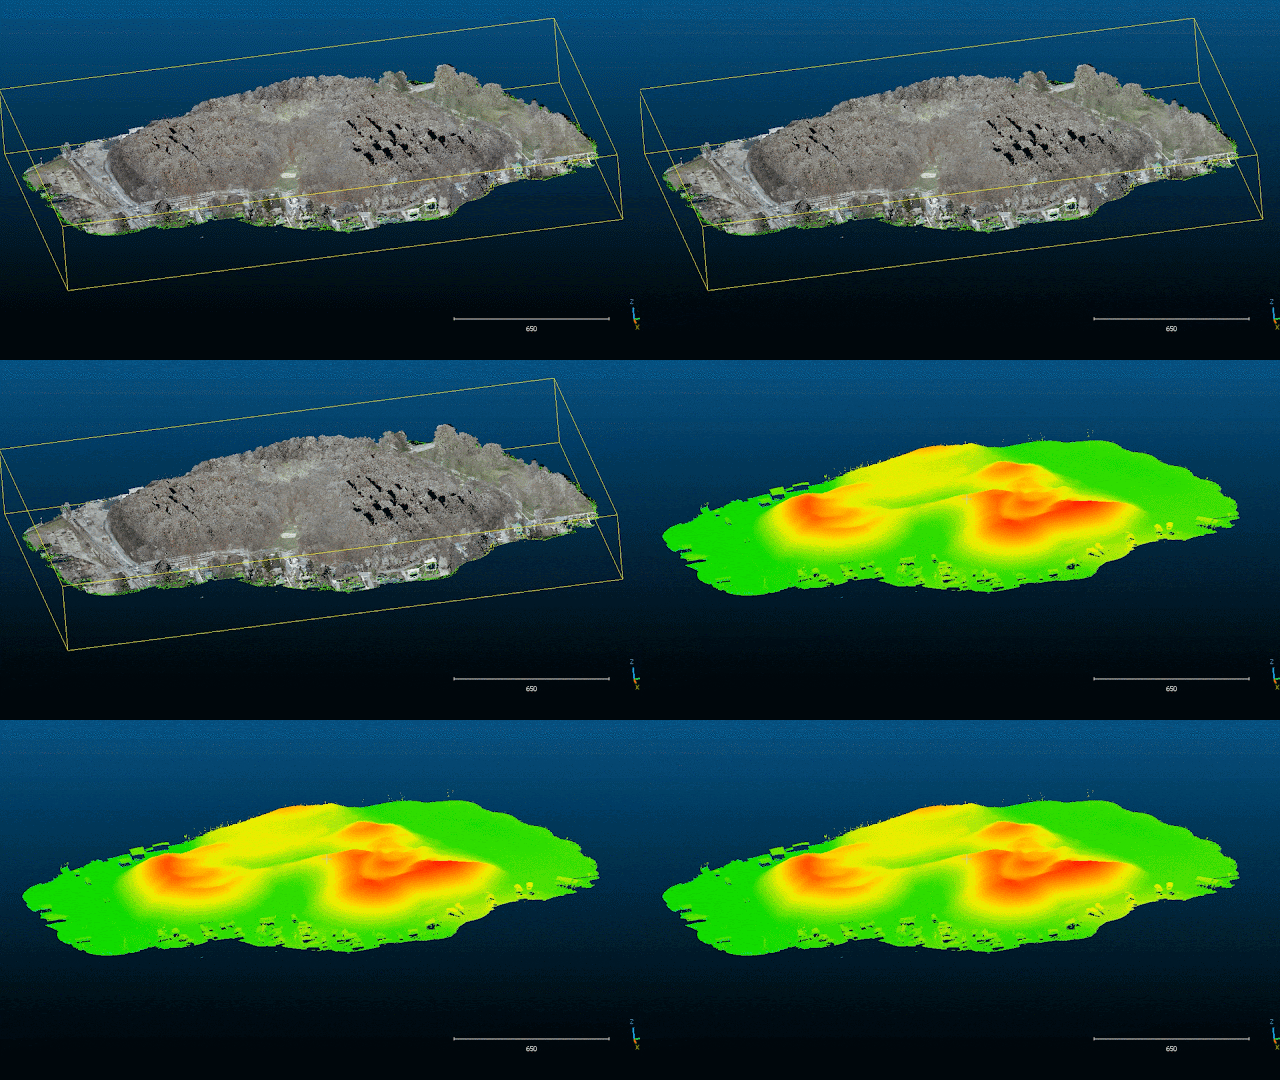
Figure 9: Vegetation Removal Using Cloud Compare

Figure 10: Looking at Vegetation Removal 

In Figure 11, the data from the L1 is presented as a surface with contour lines. It is important to note that while the surface was checked against survey grade control points and had an RMSE error of approximately 1 inch, this does not mean that the entire dataset is off by one inch. Due to the hazardous terrain, dense vegetation, and budget constraints for the project, it was not possible to survey the entire site.

However, despite these logistical limitations, the data obtained was still deemed "good enough" for preliminary design purposes and provided valuable insights into the topography of the site beneath the vegetation. After transforming the point cloud into a surface, the extracted contours were overlaid onto the surface and integrated into CAD.

It should be noted that Figure 11 is not a map and does not represent the final integrated data in CAD. The CAD and UAS data integration process is a topic that requires an entirely separate blog post, and therefore, we will not be discussing it further in this article.
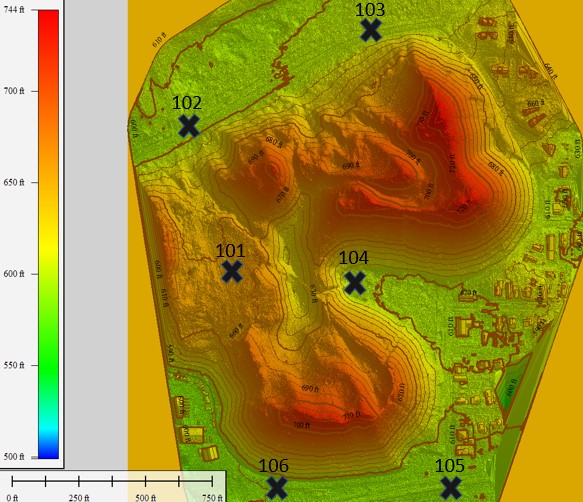
Figure 11: Example Surface Before CAD Integration 

Conclusion 

Entry-level LiDAR systems, such as the L1 sensor, can provide value to projects that require a moderate level of absolute accuracy, typically within 1-2 inches. However, claims of centimeter-level accuracy must be scrutinized to determine whether they refer to relative or absolute accuracy. It is worth noting that the L1 sensor may not be suitable for projects that demand detailed feature extraction due to its suboptimal point cloud colorization. While it is possible to improve the colorization by integrating the L1 point cloud with an orthomosaic created by a higher-quality camera, such as the P1, this approach may necessitate additional fieldwork, which comes with its limitations.

Several key takeaways emerged from a project that employed an L1 sensor in a fairly dense forest:

  • The LiDAR system was capable of covering areas beneath the vegetation, which is significant.
  • A 30-minute flight time could cover approximately 60 acres, which is impressive.
  • Generating a LiDAR point cloud was surprisingly fast.
  • Vehicle movement caused significant noise in the point cloud, which is something to consider when planning a LiDAR project.
  • To get the most out of LiDAR hardware, software beyond DJI Terra will be necessary.
  • When viewing profiles from the hard surface, L1 point clouds will exhibit a "fuzz" due to the limitations of the hardware.
  • Photogrammetry with survey-grade ground control points (GCPs) appears to work better on hard surfaces than LiDAR.
  • If survey-grade LiDAR deliverables are required, the investment may be around $500,000.

Overall, the L1 sensor is a suitable entry-level LiDAR system for projects that require moderate absolute accuracy and involve non-detailed feature extraction. However, it is essential to keep in mind the limitations and challenges that come with using this system, such as the fuzziness of point clouds and the impact of vehicle movement. Proper planning and investment in high-quality hardware, software, and GCPs are critical to ensuring successful LiDAR projects that meet specific requirements.

Saturday, February 25, 2023

Working with Our First Autel UAS

Figure 1: Autel Evo 2 Pro V2
Overview

After retiring the DJI Phantom 4 Pro, from our fleet here at USI Consultants, we decided to purchase a non  DJI platform to learn about the pros and cons of a UAS that has similar but different functions, capabilities and quirks. Since we were unsure whether an Autel product would be a comparable replacement, we did not want to spend any more money than what we paid for the Phantom 4. As a result, we purchased the Autel Evo 2 Pro V2 depicted in Figure 1.

What is Autel Robotics? 

Autel Robotics is a UAS company founded in 2014 that is one of the more prominent rivals to DJI (Da-Jing Innovations). This company produces a vast number rotorcraft consumer and enterprise UAS. Although several of their UAS products are assembled in America, their software Chinese based and their headquarters are in Shenzhen China. See Figure 2 for a brekdown of similarities and differences between Autal and DJI. 

Figure 2: Similaraties and Differences Between Autel and DJI

References from Venn Diagram: 

    Figure 3: Autel Dragonfish Video
Figure 4: Autel World Headquarters
Figure 5: DJI world Headquarters 
Figure 6: Autel foldable UAS Compared to DJI foldable UAS (Image yaken from TecRadar)
Figure 7: Autel Ceo Hongjing Li
Figure 8: DJI Ceo Frank Wang

User Experience with the Evo 2 Pro V2 UAS 

I paid approximately $1,800 for everything shown in Figure 9, and I found that the accessories are generally reliable considering the price point. However, my biggest disappointment so far is with the remote controller. In my opinion, the latency between the controller screen and the aircraft is terrible. I'm currently researching this issue because I hope it's not a common problem. I'd like to believe that Autel doesn't intentionally sell remote controllers with such poor latency to their customers.

Figure 9: Autel EVO 2 Pro V2 UAS Bundle

The Autel Evo 2 Pro drone offers a fair battery life, phone connectivity, and camera quality, along with a remote controller. It also boasts smart features, mapping capabilities, and flight log tracking, similar to a DJI aircraft. However, its radar map is great but limited in scale compared to DJI.

Despite this, the drone's foldability and mapping capabilities make it a great choice for creating Orthomosaic deliverables for engineering designs. Regarding smart features, some work well while others are overhyped and impractical. Nonetheless, the Autel Evo 2 Pro's aircraft, camera, failsafes, and smart features provide excellent value for its price.

Preliminary Conclusions

Overall, the Autel Pro V2 kit offers a reasonable price point and its aircraft and camera configuration deliver reliable performance. Personally, I have found the Autel Evo 2 Pro to be a solid choice, despite my initial mistake in purchasing the remote controller. Nonetheless, I remain open-minded and intend to thoroughly investigate whether a software update or tutorial exists to address the latency issue.